.
 Applied Membranes | Purchase Online |  Q & A | Technical Articles | Design Information | Search
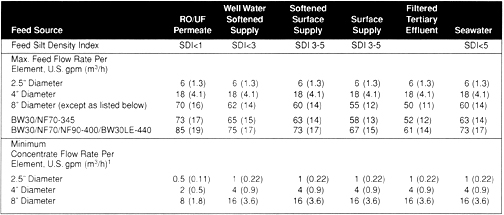
Membrane Design


Technical Bulletin on Membranes

Membrane System Design Guidelines

The factor which has the greatest influence on the membrane system design is the fouling tendency of the feed water.  Membrane fouling is caused by particles and colloidal material which are present in the feed water and are concentrated at the membrane surface.  The concentration of the fouling materials at the membrane surface increases with increasing permeate flux and increasing element recovery.  A system designed with high permeate flux rates is therefore likely to experience higher fouling rates and more frequent chemical cleaning.

The Silt Density Index (SDI) value of the pretreated feed water correlates fairly well with the amount of fouling material present.

Only experience can set the limits on permeate flux and element recovery for different types of waters.  When designing a membrane system for a specific feed water, it is advantageous to know the performance of other membrane systems operating on the same water.  However, quite often there are no other membrane systems to compare with and then the guideline below should be followed.

Permeate flux: permeate flow rate per unit membrane area.  Element recovery; ratio of permeate flow rate to feed flow rate for a single element.


Design Guidelines


Feed Source


RO Permeate


UF Permeate

Well Water/

Softened Supply

Softened  Surface Supply


Surface Supply

Filtered Tertiary Effluent


Seawater


Feed

Silt Density Index


DI<1


SDI <1


SDI<3


SDI 3-5


SDI 3-5


SDI<5


Max. Element Recovery % 40” (1m) Long Element


40


25


19


17


15*


10


10*


Max. Permeate Flow Rate

Per Element gpd (m3/D)


8040

12000 (45)

10900 (41)

7500 928)

6500 (25)

5900 (22)

4000 (15)

6000 (22)

4040

 3000 (11)

 2700 (10)

1800 (6.8)

1600 (6.1)

1500 (5.6)

1000 (3.8)

1500 (5.6)

2540

 1000 (3.8)

   900 (3.4)

  600 (2.3)

  500 (2.0)

  500 (1.9)

  300 (1.3)

  500 (1.9)


Max. Feed Flow Rate Per

Element U.S. gpm (m3/h)


8040

70 (16)

70 (16)

62 (14)

60 (14)

55 (12)

50 (11)

60 (14)

4040

16 (3.6)

16 (3.6)

16 (3.6)

16 (3.6)

16 (3.6)

16 (3.6)

16 (3.6)

2540

 6 (1.3)

 6 (1.3)

 6 (3.1)

 6 (1.3)

 6 (1.3)

 6 (1.3)

 6 (1.3)

* At permeate flow rates lower than shown in the column for Filtered Tertiary Effluent, maximum element recovery is 20% for surface water and 15% for seawater.


1We recommend that minimum concentrate flow rates be increased at the discretion of the designer by 20% for feed waters known to be high fouling tendency (SDI>3).

 
Back Home Up Next

 Determining SDI What's Nanofiltration What's Ultrafiltration Membrane Rejection Levels Temperature Correction Pressure Correction Concentrate Recycle Membrane Spectrum Membrane Design 14 Factors for RO Design Water Quality Info Reverse Osmosis Basics Problems with Chloramines and Higher pH Nitrate Removal Ion Exchange Ozone High Purity Water

Applied Membranes Product Selection Links:
[Reverse Osmosis Membranes] [Reverse Osmosis Systems][Home RO Systems][Seawater Desalination Reverse Osmosis Systems] [Media Filters, Carbon Filters, Water Softeners, Etc.] [RO Filters & Housings] [RO Membrane Housings/Pressure Vessels] [Residential RO Components] [Commercial RO Components] [RO Pumps] [Membrane Chemicals] [Ultravioloet (UV) Systems] [Ozone][Water Quality Testers  (SDI)]


All Content on this site is  intended for informational purposes for experienced water treatment professionals only.  Applied Membranes, Inc. does not assume any liability for any damages caused by the misapplication or misinterpretation of any of the information contained on this website.
© Applied Membranes, Inc. 2007